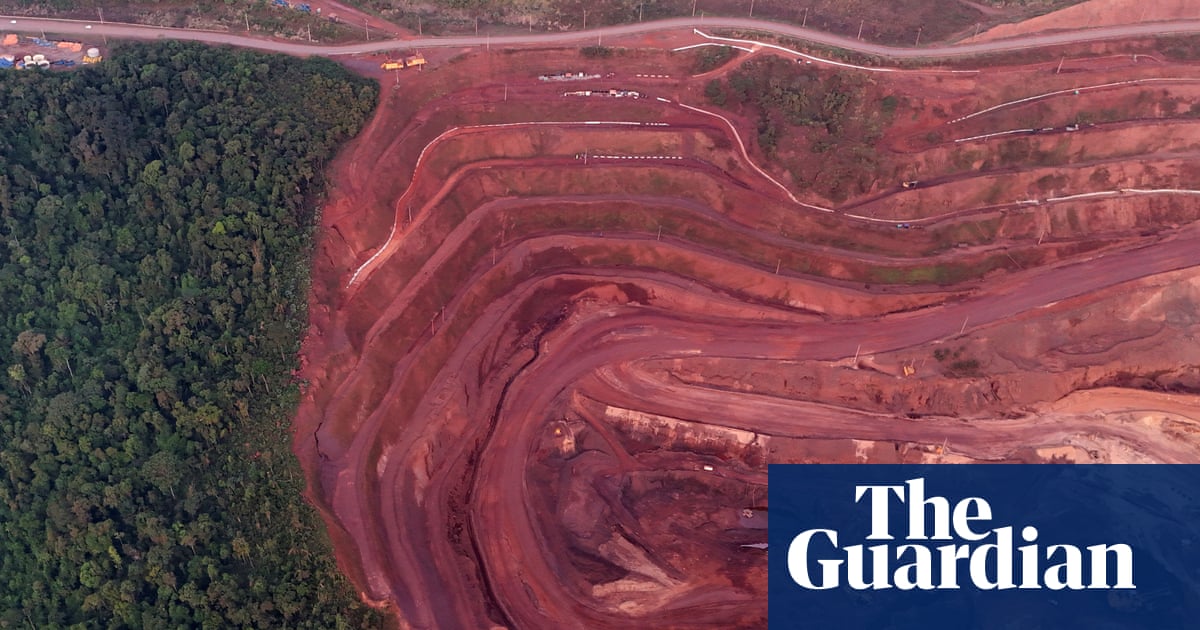
silence7@slrpnk.netM to Climate@slrpnk.netEnglish · 1 day agoRainforests pushed to breaking point by new demands for resources, report says | Need for minerals, biofuels and pulp adding to pressures from ranching, monocrops, oil and logging, analysis findswww.theguardian.comexternal-linkmessage-square1linkfedilinkarrow-up134arrow-down13
arrow-up131arrow-down1external-linkRainforests pushed to breaking point by new demands for resources, report says | Need for minerals, biofuels and pulp adding to pressures from ranching, monocrops, oil and logging, analysis findswww.theguardian.comsilence7@slrpnk.netM to Climate@slrpnk.netEnglish · 1 day agomessage-square1linkfedilink
minus-squarephutatorius@lemmy.ziplinkfedilinkarrow-up1·9 hours ago“Need” is the wrong word. “Demand” is closer.